|
Prognosis of mercury polluted groundwater spread outside industrial area of JSC ōRadikalö in Kiev, Ukraine and justification of networkof groundwater monitoring
Contents
4. Justification of network of groundwater mercury contamination monitoring
JSC ōRadikalö, Kiev (former Kiev Chemicals Plant) produced chlorine and alkali by electrolysis of water solution of sodium chloride using mercury cathode from 1954 to 1996. Total mercury losses /1/ for 42 years of the production operation was estimated to be about 700 tons including 100 tons of loses with gaseous emissions, up to 200 tons as mechanical losses which got to the foundation of the electrolysis factory, up to 5 tons as an admixture which accumulated in the storage tank for sodium chloride going to the production, up to 3 tons in the sludge lagoon being the part of non utilized mercury containing wastes. Considerable amount of mercury was deposited into building structures of the production buildings belonged to the chlorine production. Most massive mercury contamination is observed in floor slabs of the electrolysis factory and in ground under them. There are other large hot spots of soil and ground contamination on the territory adjacent to the electrolysis factory, the storage tank ¢ salt dissolvent and the sludge lagoons.
The plant is located on the left bank of Dnepr River within the industrial area of Dneprovskiy district of the town of Kiev and the first above floodplain terrace. The electrolysis shop is 4.5 km apart from Dnepr River in the area of Rusanovskiy canal. From east and south the plant is bordered by stream Plyahovyi with average of many yearsÆ water flow of 0.2 m3/± /1/ empting into Lake Nizhniy TelÆbin and further into Dnepr River. Apart from JSC ōRadikalö there are chemical enterprises Industrial Complex ōDarnaö and JSC ōKhimvoloknoö and also a power station TES-4 in the industrial area. According to the data /2/ there are at least 8 water wells in operation within 2 km zone around the source of mercury contamination one of which belongs to the enterprise ōKievvodokanalö. The difference in heights on the territory of industrial area of JSC ōRadikalö is not more then 2 m/km, there is the same horizontal relief (with absolute mark ranged from 100 to 104 m and mainly designed by filled-up sand and made-up ground with thickness of up to 5.5 m /3/) within all industrial area /4/.
Groundwater table within JSC ōRadikalö is at the depth of 1.6-5.0 m from ground surface, amplitude of its seasonal fluctuations is 0.3-1.0 m /4/. The aquifer of Upper-Quaternary and Eocene deposits being the first from surface has thickness of more than 60 m and is underlain with marl and marl clays at the absolute mark of about 35 m /5/. Quaternary stratum consists of fine clay sand with interlaces of clay loams, soil and peat lenses buried in its upper part and average- and variable-grainy sand with pebble and gravel of sedimentary and crystalline rocks in bottom part of the stratum. Thickness of the first regional basalt clay stratum ranges from 12 to 20 m /4/. The first aquifer is recharged from atmospheric precipitation and industrial leakage (also possibility of its recharge from underlying artesian aquifers was reported /5/). Groundwater of the first aquifer discharges mainly into the Dnepr River and partially into the stream Plyahovyi /5/.
Hydro carbonate-calcic groundwater predominates, their technogenic pollution is observed here and there that increases content of sulfates and chlorides there. Mineralization ranges from 0.3 to 0.7 g/l (reaching 3.0 g/l on territories of chemical enterprises) and pH ¢ from 6.9 to 9.6 /4/.
In 1990-2002 the scale of the mercury pollution within JSC ōRadikalö were estimated by Complex Hydro-geological Party of the State Regional Geological Enterprise ōSevgeologiyaö, Kiev (CHP SRGE) /2,4,6-7/, Ukrainian State Institute of Engineering-Geodesic Investigations and Surveys, Kiev (UkrSIEGIS) /5/ and JSK ōResearch Institute of Transcription, Transmission and Replicationö, HarÆkov (JSC RI TTR) /3/. First two organizations carried out traditional ecologic and geochemical investigations lying in estimation of intensity of the mercury pollution of the territory (including creation of maps of the pollution) on the basis of results of chemico-analytical determination of mercury in ground layer of air, samples of soil and construction materials (concrete), taken from trenches and boreholes within the territory of industrial area of JSC ōRadikalö and around it, bottom sediments of the stream Plyahovyi and also samples of groundwater from observation boreholes. At the same time they carried out hydro-geological studies including groundwater table observation and also single and cluster water pumping from wells.
Using mobile receiver of impulse signals with frequencies from 1 to 200 kilohertz the third enterprises (JSC RI TTR) conducted remote sensing of geopolariton radiation rising from the depth onto daylight within industrial area of JSC ōRadikalö. According to authors /3/ the estimation of character of generation and spread of this radiation allows them to carry out mapping of groundwater flows, to outline location of groundwater sources and flows and also sites of disturbance and interruption of underground flow which in turn enables to evaluate changes of areas of mercury pollution occurred for last 10 years. It is reported that spread of mercury and its compounds from the main pollution centre in the area of the electrolysis factory took place alongside with groundwater flow predominantly on vertical vector and by 1992 it had resulted in mercury accumulation on some confining layer at the depth of 32-50 m. The results of measurements also suggest that the surface of the basalt clays is wavy that is why mercury accumulation and its following horizontal spread occurred along these buried troughs. Because increased groundwater flow rate in the buried erosion depressions mercury and its compounds have spread in radius of 4 km around the industrial area of JSC ōRadikalö and can reach the Dnepr River and Rusanovskiy bay.
Procedures of ecological-geochemical and chemical-analytical field works conducted by CHP SRGE and UkrSIEGIS /2, 5, 7/ are typical for geological enterprises of former USSR, which at present do research in the area of environment protection. They are guided by Soviet (of 1980s-1990s) GOSTs and sanitary rules and norms (SanPIN) and use atomic absorptive spectrophotometers (AAS) ōYulia-2öand ōAGP-01ö and chemical-analytical methods of factory-producers of these instruments.
The results obtained /2,5,7/ characterize the area of contamination as technogenic hot-spot geochemical mercury anomaly of near-surface grounds with thickness of down to 3 m and area of about 1 km2 (the area of the industrial site of JSC ōRadikalö is 0.6 km2). The main massif of contamination (about 90 % of the total area) was reported as a few centimeters thick and intensity ranged from 1 to 10 of the maximum permissible concentration for soil (MPCs) (i.e. from 2.1 to 21 mg/kg). Three the biggest hot spots with intensity of contamination exceeded 10 MPCs (21 mg/kg) have total area of about 0.08 km2. The greatest intensity and depth of the soil pollution were found at the range of g/kg and found localized around both the chlorine production building (mercury content in concrete floor of the electrolysis factory reaches the value of 10 g/kg range) and the sludge lagoon.
The main forms of mercury in soil-ground are elemental mercury and also sulfide and oxide of mercury. Elemental mercury volatilizes polluting an atmosphere (there is exceeding mercury content over MPCs (0.0003 mg/m3) in the air at the height of 1.0-1.5 m from the ground surface on more than 40% of total territory of ōRadikalö in summer time. Elemental mercury and mercury oxides pollute surface water and groundwater with soluble and other movable forms of mercury. Migration of metal mercury across is impossible and down to the depth of a few meters is improbable even for the most intensive hot spots of contamination located under the building of electrolysis factory. Migration of mercury across and down happens generally because of transport of soluble and other movable forms of mercury with water. Mercury migration across is also possible as a result of re-precipitation of mercury vapors, however because of their quick dispersion in atmosphere amount of mercury transferring on ground surface by this way is negligible. Mercury vapors and also mercury contaminated surface and groundwater pose the risk to public health.
Bottom sediments in the stream Plyahovyi are contaminated with mercury up to the level of 100 mg/kg; however mercury content in its surface water does not exceed MPCw (0.0005 mg/l) due to quite high water discharge there.
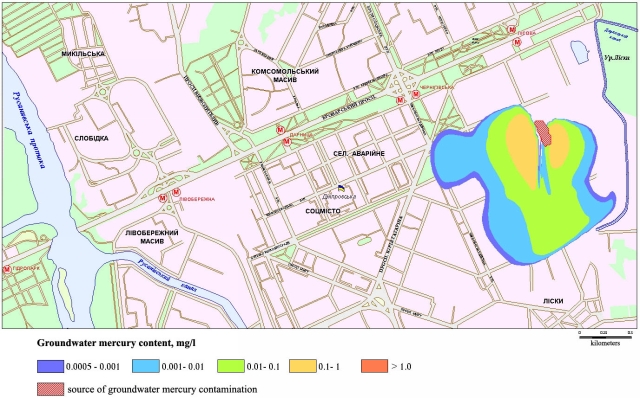
According to authors /2/ the area of aquifer which is the first from the ground surface and contaminated with mercury above MPCw is more than 1.5 km2 (an axis of the area of contaminated groundwater has drifted 250 m south-east from the electrolysis factory along the groundwater flow) and is confined by the stream Plyahovyi from east, south-east and south sides. At that the groundwater are contaminated with mercury above the level of 0.1 mg/l (200 MPCw) within the territory of 0.05 km2 around the electrolysis factory. There are three hot spots of groundwater mercury contamination with mercury concentration more than 0.01 mg/l (20 MPCw) in water along the perimeter of the contaminated area at its south-east part: one of them (east one) is localized on the territory of the sludge lagoon and two south ones are 400 m beyond the territory of JSC ōRadikalö industrial site. At least one of them can be result of mercury contaminated groundwater pinch to the ground surface. The depth of mercury contaminated groundwater occurrence is generally 10-15 m from the ground surface excluding those under the electrolysis factory. Here mercury concentration in water remains very high (more than 0.1 mg/l) down to maximum depths of testing, i.e. 21-22 m from the ground surface.
Mercury content has not exceeded the detection limits of exploitable analytical instruments in any of operating boreholes reaching aquifers which are the second and the third from ground surface the in left-bank part of Kiev City /2/.
3. Preparation of prognosis of mercury contamination spread using methods of mathematical modeling of hydro-geological processes. Preparation of prognosis of mercury contamination spread using methods of mathematical modeling of hydro-geological processes.
The territory of survey is located in the region of interlink of north-east slope of Ukraine crystalline shield and Dneprovsko-Donetskaya depression on the left bank of the Dnepr River within first above-floodplane terrace.
To make a prognosis of spread of groundwater mercury contamination area in order to justify the design of monitoring network.
There was used the data from /1-2, 4-7/ and also from /8/.
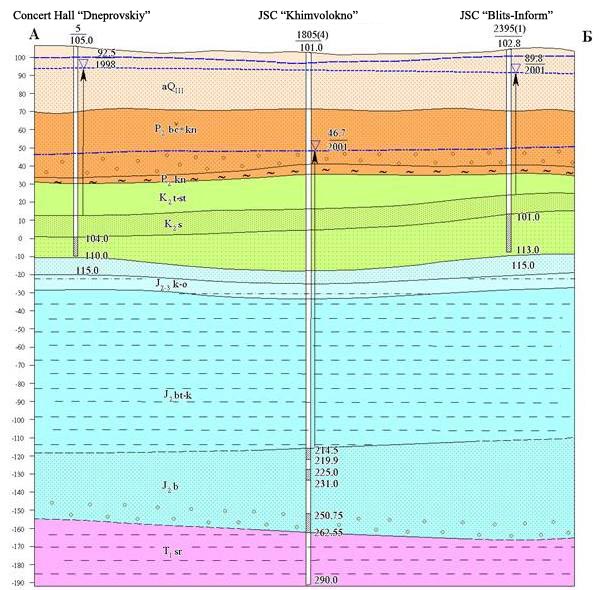
There are following aquifers and complexes (figure 1)
on the described territory: the aquifer of Upper-Quaternary deposits of
the first, second and third above-floodplain terraces (ÓQIII);
the aquifer of Eocene deposits (
Water bearing horizons of Upper-Quaternary and Eocene deposits are connected hydraulically. Water bearing deposits represent small-grained, clay and dust sands with the interlayers of loam and loamy sand. According to the data of experiment-filtrational works filtration coefficients of Upper-Quaternary deposits range from 3-4 to 10 meters per day and the filtration coefficient of Eocene deposits is about 4 meter per day. Upper-Cretaceous deposits consisting of Marl-Cretaceous mass of Cenomanian, Turonian and Cognac layers of total thickness of about 20 m to be the first from the ground surface regional impervious stratum. Depth of occurrence of Upper-Cretaceous deposits is 60-70 m. The modeled roof of Upper- Cretaceous deposits was schematized as impervious border, absolute marks of which range from 30 to 40 m within the model-based area. The model boundaries in horizontal projection coincide with the scope of research conducted within the project /2/ (figures 2-3).
LEGEND
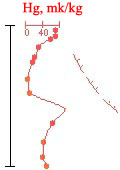
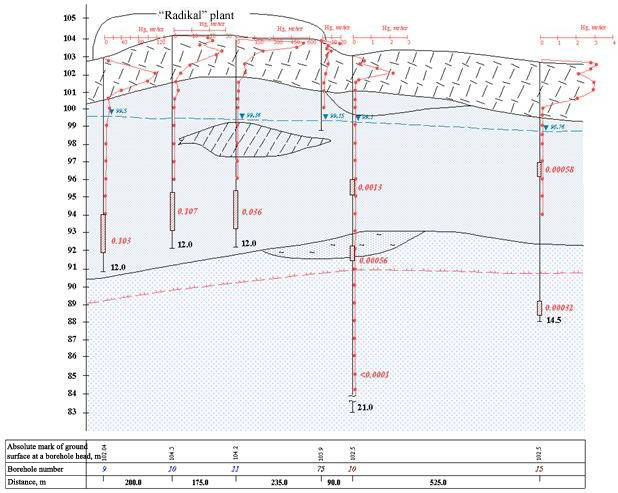
Fig. 1. Schematic geological- hydro-geological cross section along the line A-B
LEGEND
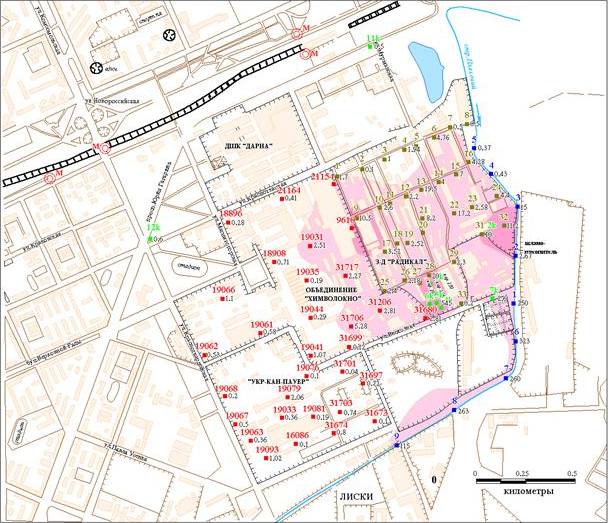
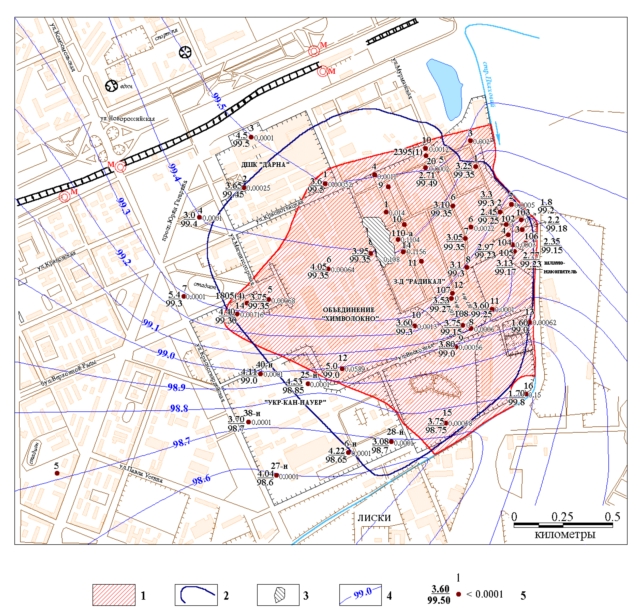
Fig. 2. Map of topsoil contamination in the area of ōRadikalö plant as of 2002
LEGEND
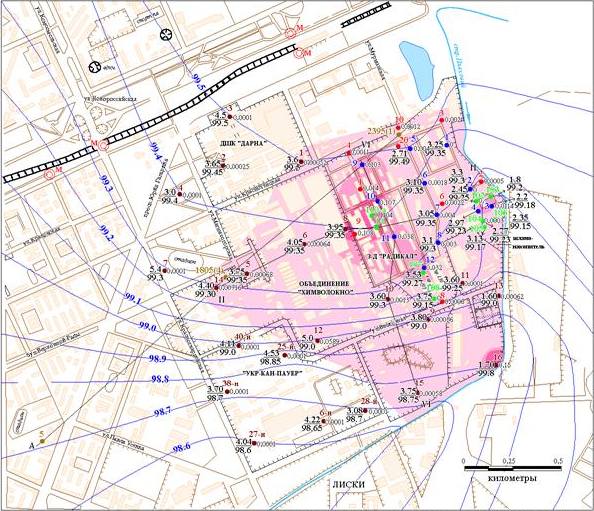
Fig. 3. Map of hydroisohypses of upper aquifer the first from ground surface and mercury content in groundwater in the area of ōRadikalö plant as of 2002
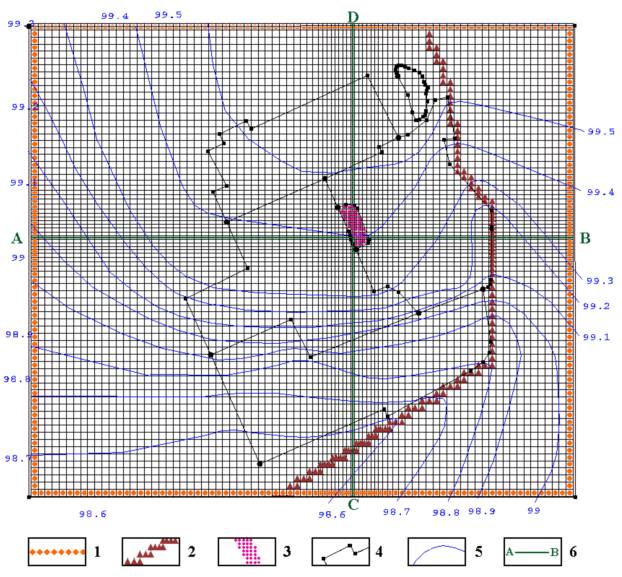
On outer boundaries of the model the type 1 boundary condition was established with groundwater tables no variable with time. The stream Plyahovyi is schematized by the type 3 boundary condition. The simulated area is approximated by rectangular grid size of which is M*N = 85*77 nodes. Grid size varies from 20 m near the source of pollution to 40 m at peripheral sections of the model (fig. 4).
Fig. 4. Schematization of simulated area in horizontal projection
1 ¢ lines of establishment of type 1 boundary conditions; 2 ¢ lines of establishment of type 3 boundary conditions; 3 ¢ area of establishment of the source of groundwater mercury contamination; 4 ¢ boundary of the industrial area; 5 ¢ hydroisohypses, numerals ¢ absolute marks of groundwater table, m; 6 ¢ lines of schematic cross sections.
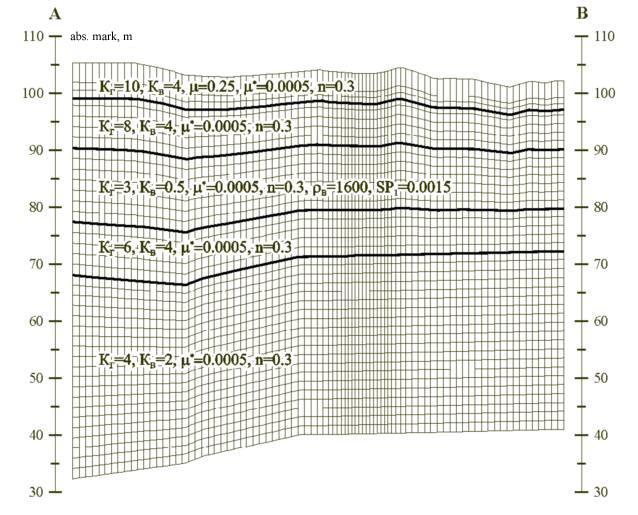
In section the simulated area was schematized in 5 layers with different filtration and migration parameters (fig.5).
Fig.5. Schematization of simulated area in section
CH ¢ horizontal coefficient of filtration, m/day; CV ¢ vertical coefficient of filtration, m/day; m- coefficient of gravitational water loss, dimensionless quantity; m* - coefficient of elastic water-loss, 1/m; n ¢ porosity, dimensionless quantity; rB ¢ stratum density, kg/m3; SP1 ¢ first sorption constant, dimensionless quantity
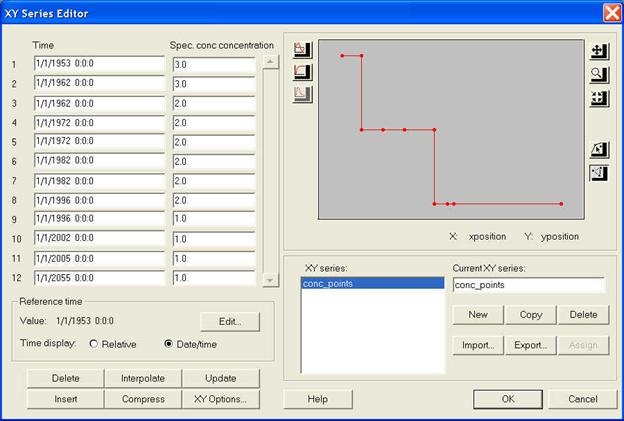
The layersÆ boundaries are distinguished on the base of lithologic structure peculiarities of the simulated area (fig. 6-7). Representation of the grid approximation of the simulated area in section is shown at the figure 5. The quantity of grid steps on vertical line is 40. Groundwater recharge in natural specified undisturbed conditions (prior to 1954) was due to infiltration of atmospheric precipitation and inflow along outer boundaries. Groundwater discharge was reported through outer boundaries and into the stream Plyahovyi. Since 1954 after putting the plant ōRadikalö into operation an additional source of groundwater recharge has arisen as a result of loses from water supply system which was schematized on the model as an additional recharge. Since 1996 the additional recharge has been excluded from the model because of the plant closing. It was supposed that groundwater contamination with mercury has been started since 1954 as a result of different reasons (incidents, losses of a process solution containing mercury and so on). The main mercury source is located under buildings 1, 2, 3, 88, 102, 105, 140, 140Ó. On the model it was schematized as a boundary type 1 condition the area which mercury concentration in groundwater was established for). It was assumed that mercury concentration in the source was 3 mg/l from 1954 to 1962, then it was keeping at the level of 2 mg/l for 25 years, and since 1996 ¢ 1 mg/l due to the production closing.
LEGEND
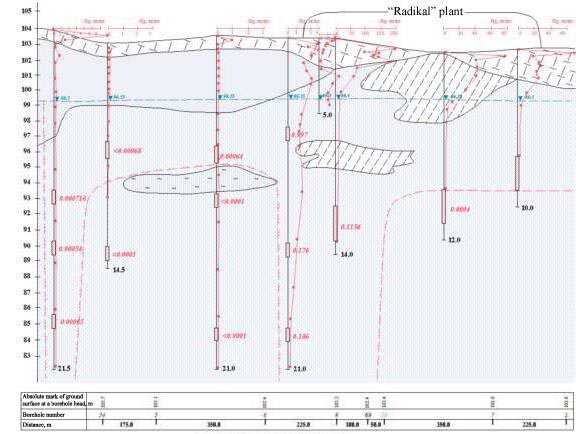
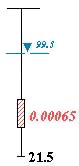
Fig. 6. Geological-hydro-geological cross section along the line II-II /2/
LEGEND
Fig. 7. Geological-hydro-geological cross section along the line IV-IV /2/
Fig.8. Established in the model graph of mercury content variation in the sources
The mercury concentration in the source in 2002 was specified according to the data /2/. Mercury concentration on the initial moment of modeling (1953) was being chosen in the process of the model calibration (see below). The source of mercury was considered to be located at the upper part of the cross section by groundwater surface. The model simulated the convective mercury transport. It was supposed that process of mercury adsorption took place in the layer to be the third from the earth surface (fig. 4) which was mainly represented by dust sand. Value of the adsorption constant was being chosen in the process of the model calibration.
Brief characteristics of simulation system GMS 3.1
In order to create the model the groundwater modeling system GMS 3.1 which was successfully used for simulation of groundwater mercury contamination in Northern Industrial Area of Pavlodar, Kazakhstan /9-11/ earlier in 2000-2001 in framework of international project ICA2-CT-2000-10029 ōDevelopment of cost-effective methods for minimizing risk from heavy metal pollution in industrial cities: A case study of mercury pollution in Pavlodar" ("Toxicmanagement") funded through EU INCO-2 Program was chosen. The model enabled to understand the mechanism of both groundwater flow formation in the industrial area and its change (diversion, alteration) in the process of the town of Pavlodar development and also to predict formation of the mercury contaminated groundwater plum 250 m wide spreading 2500 m from the source of contamination at the depth of 5-18 m. Thirty-year prognoses of the plume spread depending on man-caused changes in hydro-geological conditions in the Northern Industrial Area have enabled to develop cost effective engineering solutions to minimize the risk of mercury contamination posed to environment and population. GMS 3.1 was developed by Modeling Research Laboratory of Brigham Young University, USA /14/. Having had broad functional capabilities it is one of the most perfect simulation systems for hydro-geological processes modeling.
Function and structure of the simulation complex
GMS 3.1 system is designed for simulation of both groundwater movement and transport of components dissolved in the water in zones of full and not full saturation, tracing the flow lines etc. The complex also involves instruments for a model calibration and results visualization and also for creation of triangulation no regular network, construction of three-dimensional stratigraphic models and some other components. Full version of the system contains a graphical user interface and a set of programs - MODFLOW, MT3DMS, RT3D, SEAM3D, SEEP2D, FEMWATER, UTCHEM, NUFT, PEST, MODPATH. The programs destinations are in Table 1.
Table 1 - GMS 3.1 programs and their destinations
Graphic interface is divided into 10 modules ¢ TIN, Borehole, Solid, 2D Mesh, 2D Grid, 2D Scatter Point, 3D Mesh, 3D Grid, 3D Scatter Point, Map. There is a list of modules and their main functions in the table 2.
Table 2. List of GMS 3.1 system modules and their functions
GMS 3.1 programs and modules listed in tables 1 and 2 and marked by yellow were used for simulation of spread of groundwater mercury contamination in the area of JSC ōRadikalö.
The model production, simulation procedure and the results of the model calibration
The simulation was conducted by several steps: Ę Schematization of hydro-geological conditions and the problem definition (see above), Ę The model production by means of GMS, Ę The model calibration, Ę Salvation of Prognosis Tasks, Ę The results analysis.
The purpose of the calibration is to prove the model adequacy to natural hydro-geological conditions. The calibration involved solving an inverse stationary hydro-dynamic problem, an inverse non stationary hydro-dynamic problem and an inverse problem of mercury transport with groundwater.
On solving the inverse stationary hydro-dynamic problem conditions existed in undisturbed period (in 1953) were reproduced. On the model groundwater tables for this time were calculated and compared to the actual groundwater tables. In 1953 groundwater tables is assumed to be similar to those found in the result of the research of 2002 /2/. On multiple solving the problem groundwater infiltration recharge and also hydraulic resistance of bottom sediments in Plyahovyi stream were being chosen and values of coefficients of both water bearing strata were being adjusted to be more accurate. Coincidence between modeled groundwater tables and actual ones measured in wells was fidelity criterion of such choice. Besides adjusted filtration coefficients had not to contradict the results of experimental-filtration works taking into account accuracy of experimental data. Groundwater tables calculated on the model not more than 10-20 cm differ from actually measured ones. Hence the inverse stationary task is considered to be solved successfully.
On solution of the inverse stationary hydrodynamic task change in position of groundwater table surface for the period since 1953 till 2002 was simulated in the model. In the model an additional source of groundwater recharge was introduced for the period since 1953 till 1996 in the area of the buildings 1, 2, 3, 88, 102, 105, 140, 140Ó simulating water losses from underground pipeline. The fact of formation of a dome at groundwater surface as a result of the losses was recorded in /5/. On solving the inverse stationary hydrodynamic task the value of water losses from underground pipeline were being adjusted in the model. The additional source of groundwater recharge in the area of buildings 1, 2, 3, 88, 102, 105, 140, 140Ó was excluded in the model since 1996.
On salving the inverse mercury transport task displacement of the spot of groundwater mercury pollution for the period since 1953 till 2002 was reproduced in the model. Both mercury concentration in the source and sorption constant were being adjusted. The result of the task solution is sown on the figure 9.One can see the position of the area of groundwater mercury contamination simulated in the model coincides quite well with actual data. Hence the conclusion is that the model calibration has been done successfully.
Solution of the prognosis tasks
In the standardized model several scenarios of prognosis tasks for 50 years have been solved.
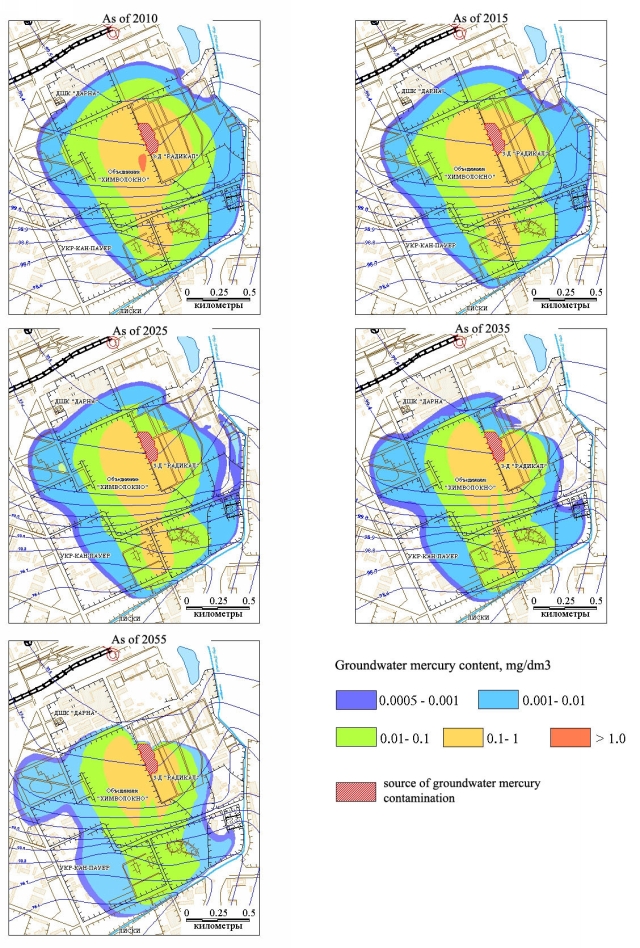
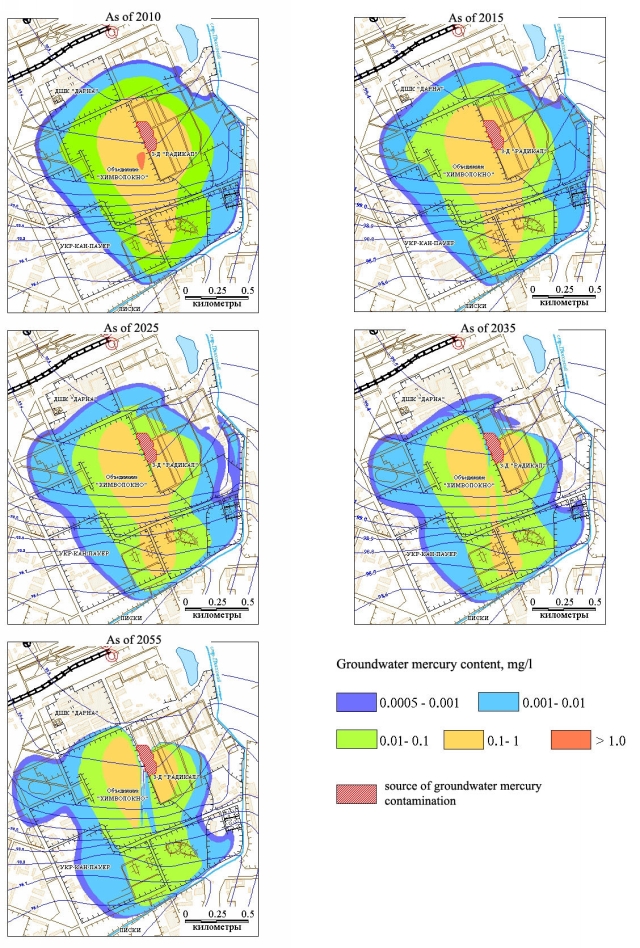
First scenario of the prognosis allowed for persistence of the source of groundwater mercury pollution close to buildings 1, 2, 3, 88, 102, 105, 140, 140Ó in the upper part of the cross section for all prognosis period. The mercury concentration in the source was considered to be at the level of 2002 i.e. about 1 mg/l. The results of the simulation are shown on the figures 10-15.
Second scenario of the prognosis allowed for total containment (for example at the cost of total extraction of mercury contaminated grounds and construction structures) of the source of groundwater mercury contamination close to buildings 1, 2, 3, 88, 102, 105, 140, 140Ó in upper part of the cross section for all prognosis period. The results of the simulation are shown on the figures 16-21.
Analysis of the simulation results
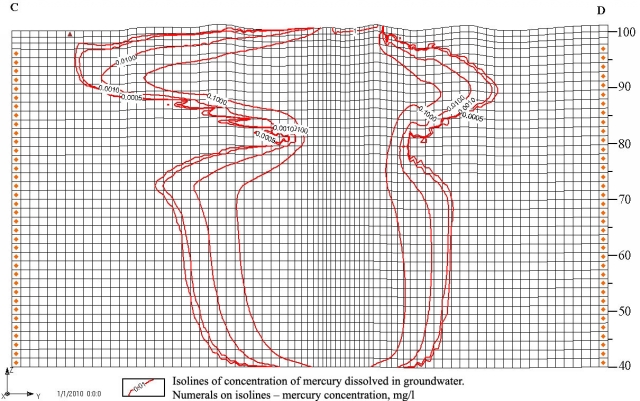
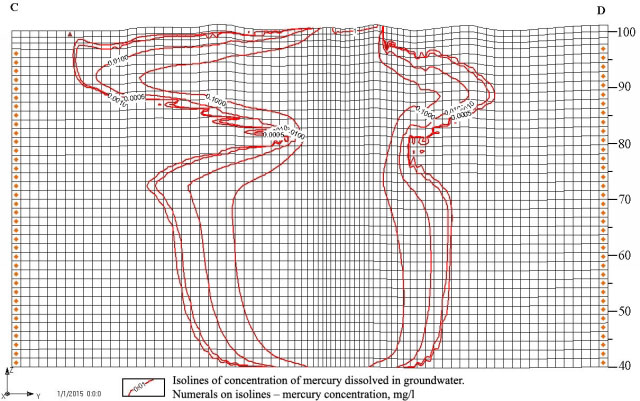
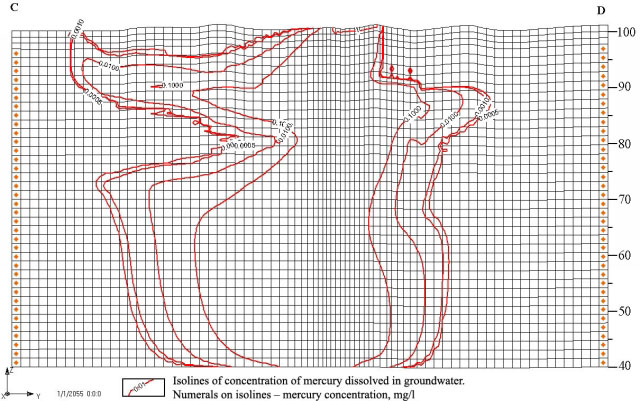
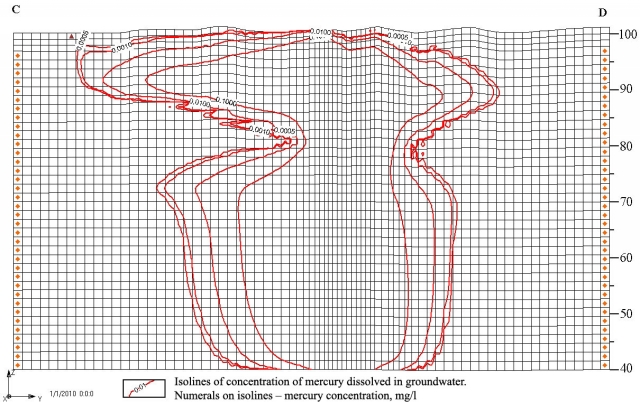
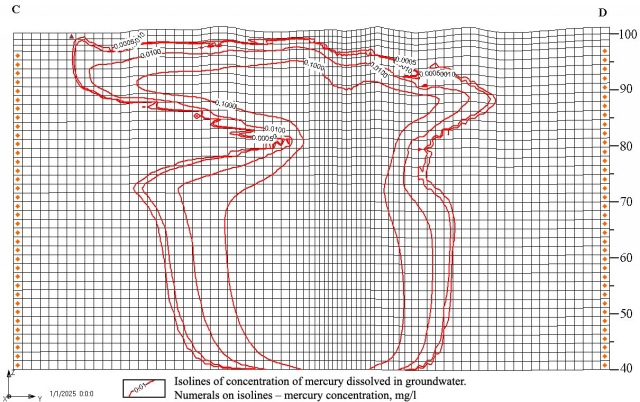
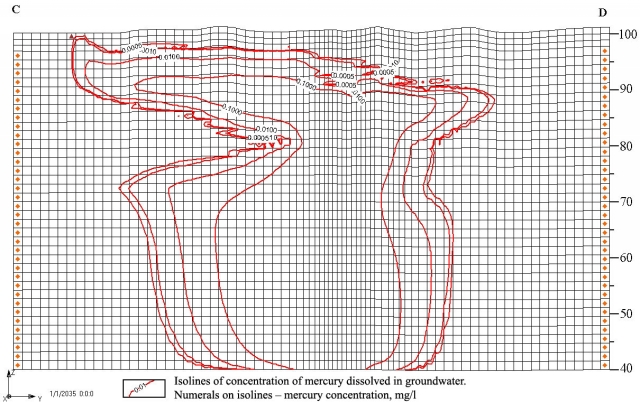
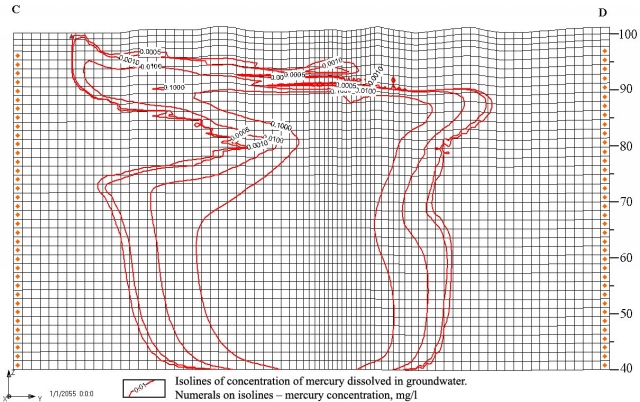
How it can be seen on the figures 11-15 and 17-21 mercury concentration in groundwater is not being changed substantially with depth. That is why the prognostic maps of groundwater mercury contamination spread were produced for depth of about 12 m from the earth surface that generally corresponds to maximal spread of the plume of the contamination.
On the first scenario the groundwater contamination plume will have shrunk slightly by the end of the prognosis period. The plume will have moved up to 250-300 m west and south-west (see fig.10). In general the plume shrinking results from excluding the source of the groundwater recharge in the vicinity of the buildings 1, 2, 3, 88, 102, 105, 140, 140Ó.
On the second scenario allowing for total containment of the source in the upper part of the cross section the plume of groundwater mercury contamination also will have moved 250-300 m west and south-west (see fig.16) by the end of the prognosis period. In section in the area of the buildings 1, 2, 3, 88, 102, 105, 140, 140Ó upper boundary of the plume will have gone down to the depth of 4-6 m by 2055 (see fig.17-21). It results from containment of the source of groundwater mercury contamination.
Analysis of the results of the simulation enables to state that the plume of groundwater mercury contamination will not reach the Dnepr River during nearest 50 years (see fig. 22). At the same time it is necessary to take into account that even in case of complete containment of the source of contamination under the buildings 1, 2, 3, 88, 102, 105, 140, 140Ó mercury can remain in the groundwater for long time. That is why it is necessary to prohibit categorically using groundwater of Quaternary and Eocene deposits for drinking water supply within spread of prognostic plume of mercury contamination and 2 km zone around it.
Intensive water withdrawal out of Upper Quaternary and Eocene deposits can also entail changing the configuration the plume of groundwater mercury contamination.
From east and south spreading the plume of groundwater mercury contamination is confined by stream Plyahovyi where groundwater horizon is discharged to. Together with groundwater mercury contained there can get to the stream Plyahovyi. Calculations based on the results of the simulation and data on water discharge in the stream Plyahovyi /1/ show that mercury concentration in water of the stream Plyahovyi would not exceed maximum permissible concentration in water (MPCw). However when designing monitoring system it is necessary to make provision for regular testing the water from the stream Plyahovyi for mercury content there.
Area of spread of groundwater with mercury concentration of more than 0.0005 mg/l (as of 2002); 1 ¢ according the facts: 2 ¢ according the results of simulation; 3 ¢ the source of groundwater mercury contamination under the shops 1, 2, 3, 88, 102, 105, 140, 140Ó; 4 ¢ hydroisohypses and their absolute marks, m; 5 - boreholes, tested for mercury content in water; Numerals: above ¢ borehole numbers; on the left in nominator ¢ depth of steady-state groundwater table, m, in denominator ¢ absolute mark of groundwater table, m; on the right ¢ groundwater mercury content in different sampling intervals, mg/l
Fig. 9. Schematic map of groundwater mercury contamination
Fig. 10. Results of simulation of groundwater mercury contamination in the area of JSC ōRadikalö (first scenario of prognosis)
Fig. 11. Results of simulation of groundwater mercury contamination in the area of JSC ōRadikalö. Cross section along the line C-D (first scenario of prognosis as of 2010-2055)
Fig. 12. Results of simulation of groundwater mercury contamination in the area of JSC ōRadikalö. Cross section along the line C-D (first scenario of prognosis as of 2015)
Fig. 13. Results of simulation of groundwater mercury contamination in the area of JSC ōRadikalö. Cross section along the line C-D (first scenario of prognosis as of 2025)
Fig. 14. Results of simulation of groundwater mercury contamination in the area of JSC ōRadikalö. Cross section along the line C-D (first scenario of prognosis as of 2035)
Fig. 15. Results of simulation of groundwater mercury contamination in the area of JSC ōRadikalö. Cross section along the line C-D (first scenario of prognosis as of 2055)
Fig. 16. Results of simulation of groundwater mercury contamination in the area of JSC ōRadikalö (second scenario of prognosis)
Fig. 17. Results of simulation of groundwater mercury contamination in the area of JSC ōRadikalö. Cross section along the line C-D (second scenario of prognosis as of 2010)
Fig. 18. Results of simulation of groundwater mercury contamination in the area of JSC ōRadikalö. Cross section along the line C-D (second scenario of prognosis as of 2015)
Fig. 19. Results of simulation of groundwater mercury contamination in the area of JSC ōRadikalö. Cross section along the line C-D (second scenario of prognosis as of 2025)
Fig. 20. Results of simulation of groundwater mercury contamination in the area of JSC ōRadikalö. Cross section along the line C-D (second scenario of prognosis as of 2035)
Fig. 21. Results of simulation of groundwater mercury contamination in the area of JSC ōRadikalö. Cross section along the line C-D (second scenario of prognosis as of 2055)
Fig. 22. Schematic map of groundwater mercury contamination based on the results of simulation as of 2055
4. Justification of network of groundwater mercury contamination monitoring
Occurrence of mercury contamination in the area of JSC ōRadikalö and especially groundwater pinch along the perimeter of the plum of mercury pollution requires creating long-term network of observation boreholes having different intervals in water sampling within the aquifer to be the first from the earth and also arrangement of systematic seasonal observations over both groundwater tables in three upper aquifers and mercury concentrations there. Such work should be done by a specialized monitoring laboratory which has both sensible mercury analyzers (atomic absorptive spectrophotometer - AAS or atomic fluorescent spectrophotometer ¢ AFS) available which can determine mercury in water down to the level of 0.0001 ¢ 0.0005 mg/l and opportunity to work with up-to-date methods of surface water and groundwater sampling and their analysis.
1. Mercury geochemical anomaly of surface grounds formed at the territory of JSC ōRadikalö is the source of secondary pollution of an atmosphere by mercury vapor and of groundwater by mobile mercury forms. Due to significant losses of water taken place in workshops of the chlorine production and also particularities of hydro-geological conditions at the place of pollution the main flow of mercury contaminated groundwater went vertically downward and probably has reached regional basalt clay. Dispersion of this flow and groundwater circulation within aquifers to be the first and the second from ground surface entailed formation of the plum of mercury contaminated groundwater spread of which to south and east direction is confined by the stream Plyahovyi. 2. Analysis of the results of simulation suggests that the plum of groundwater mercury contamination will not have reached the Dnepr River for nearest 50 years. 3. At the same time even in a case of complete containment of the main source of groundwater mercury contamination the plum of the contamination can remain for a long time within its present bounds. Thereupon creation of a model of groundwater mercury contamination is required which would have higher credibility in details of data and prognosis interpretation. Also it is necessary to establish the groundwater mercury contamination monitoring network which will enable collecting a hydro-geological data base on the mercury contamination which will be accurate, reliable and comprehensive.
1. L.E.Postolov. Mercury contamination of the industrial area of JSC ōRadikalö in Kiev City and engineering solution on final demercurization of chlorine and alkali production being out of operation at JSC öRadikalö. Evrohim, Kiev, 2004, 4 p. 2. O.P. Nikitash, V.L. PrikhodÆko. Assessment of impact of groundwater mercury contamination in the area of ōRadikalö plant on the drinking groundwater of Kiev (contract N3õ 8/240600/10 from 25.12.2001). Book.1.State regional geological enterprise ōPivnichgeologiyaö, Complex Hydro-geological Partyö, Kiev, 2002, 105 p. 3. Yu.A. Bogdanov, Yu.S. Yurakov. Expert appraisal of mercury contamination within the industrial area of JSC ōRadikalö in Kiev. JSC ōResearch Technological Institute of Transcription, Translation and Replicationö. KharÆkov City, 2002, 31 p. 4. V.S.Metalidi, O.P.Nikitash. Preparation of hydro-geological materials for creation of a mathematical model of mercury contamination migration within the territory of the plant ōRadikalö in Kiev. (contract ╣68/05 from 05.09.2005). State regional geological enterprise ōPivnichgeologiyaö, Complex Hydro-geological Partyö, Kiev, 2005, 27 p. 5. A.V.Shah, V.B.Vavrovskiy, A.M.Marchenko. The report on the results of estimation of mercury contamination of Kiev chemicals plan industrial area. Contract 273. Ukraine State Institute of Engineering-geodesic Research and Survay, Kiev, 1992, 80 p. 6. N.P,Pryadun, L.P.Kovaleva. The results of Ecological-geochemical investigation of the territory of JSC ōRadikalö. State geological enterprise ōPIVNICHUKRGEOLOGIYAö, 1996, 22 p. 7. B.F.Filimonov. Report on the contract ╣5/2002 from 30.01.2002 ōStudy of ōRadikalö territories and shops, analyses of environmentally dangerous contaminants remaining, compilation of maps of their distribution and the development of engineering solution for their decontaminationö. Kiev Research Institute of Synthesis and Ecjlogy ōSINTEKOö with JSC ōRadikalö, Kiev, 2002, 138 p. 8. Groundwater modeling system. Version 3.1 Tutorial manual. Environmental Modeling Research Laboratory of Brigham Young University. USA. 2000. 9. T.W.Tanton, V.V.Veselov, M.A.Ilyushchenko, V.Yu.Panichkin. Assessment of risk posed by mercury contamination of Northern industrial area of Pavlodar City. Reports of National Academy of Sciences of the Republic of Kazakhstan . ╣4, 2003, P.78-81. 10. V.Yu.Panichkin. Geo-informational mathematical simulation of hydro-geological systems of Kazakhstan. Abstract of doctor degree dissertation. Almaty, 2004, 48 p. 11. M.A.Ilyushchenko, L.V.Kuzmenko, E.V.Lapshin. R.I.Kamberov. Management and monitoring of mercury contamination in Pavlodar, Kazakhstan.. 2005, 62 p. http://Hg-Pavlodar.narod.ru |
||||||||||||||||||||||||||||||||||||||||||||||||||||||||||||||||||||||||||||||||||||||||||||||||||||||||||||||||||||||||||||||||||||||||||||||||||||||||||||||||||||||||||||||||||||||||||||||||||||||||